Vehicle information
| Brand: | Volkswagen |
| Model: | Golf 4 GTI |
| Year: | 1999 |
| Engine: | 1.8 L 20v Turbo |
| Engine code: | AGU |
| Cylinder count: | 4 |
| Fuel type: | Petrol |
| Motor management system: | Motronic 3.8.3 |
Used equipment

Automotive Test Scope ATS5004D
4 channel automotive oscilloscope with differential inputs
Accelerometer TP-ACC20
2 channel acceleration sensor
APS260
Absolute Pressure sensor
Measure lead TP-C1812B
low noise differential BNC to banana measuring lead, 3 m
Back Probe TP-BP85
thin and flexible back probeThe Automotive Test Scope ATS5004D is in this article also referred to as automotive oscilloscope, as diagnosis oscilloscope and as lab scope.
Problem description
A 1999 Golf 4 turbo GTI with AGU engine and a maximum power of 109 kW was having serious problems with accelerating. Accelerating from 0 to 80 km per hour would take approximately 16 seconds, which is far too long for this car. Apart from the lack of power, the engine would hold back every half second and produce a lot of explosions in the exhaust.
The garage could not pull any error codes from the car. They had to rely fully on their own diagnosis. A lot of components were replaced, including the turbo, the ECM, Mass Air Flow sensor, ignition module and a turbo pressure valve. Nothing helped, the problems remained.
Measuring
Measuring the engine power
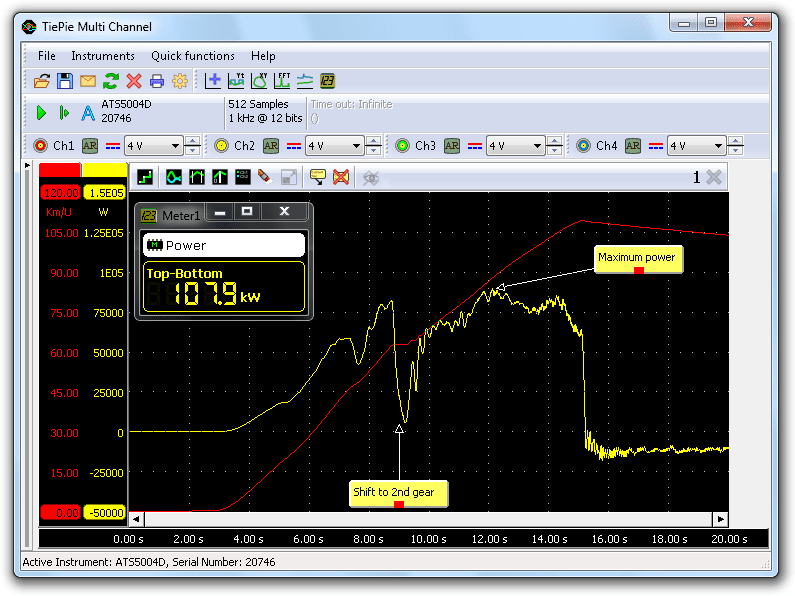
The first measurement that was performed was a check of the engine power. With the Accelerometer TP-ACC20 connected to the diagnosis oscilloscope, a test run was done: accelerate the car with full throttle through the second gear. A special function in the automotive lab scope software then calculates the actual speed and the engine power from the measured signals and displays both graphs.
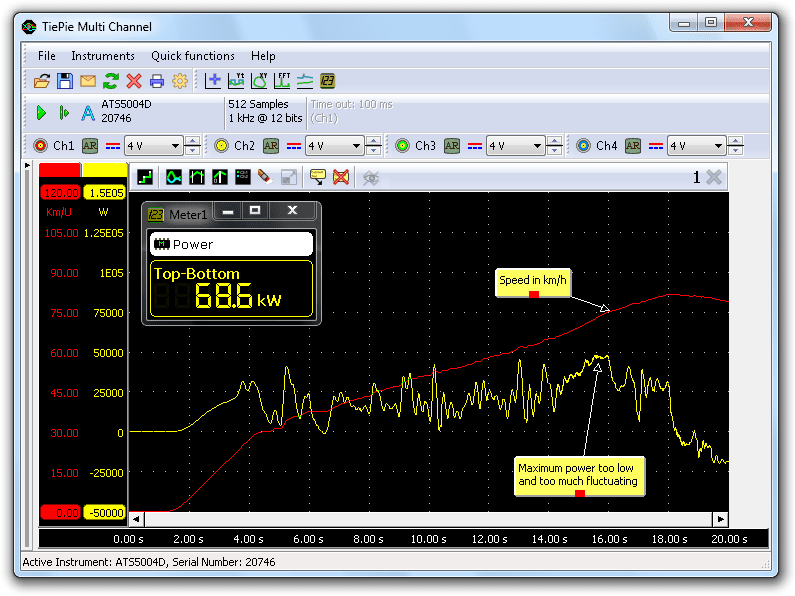
Figure 1 shows an acceleration from 0 to 80 km/h in about 16 seconds, a strong fluctuating power graph which remains too low and a determined engine power of almost 69 kW.
Measuring the Mass Air Flow sensor signal
The garage had focused on the turbo and the air flow in the engine, so the next step was to measure ignition signals, injection signals and the Mass Air Flow (MAF) sensor signal. Figure 2 shows the injection signal and the MAF signal when the engine holds back.
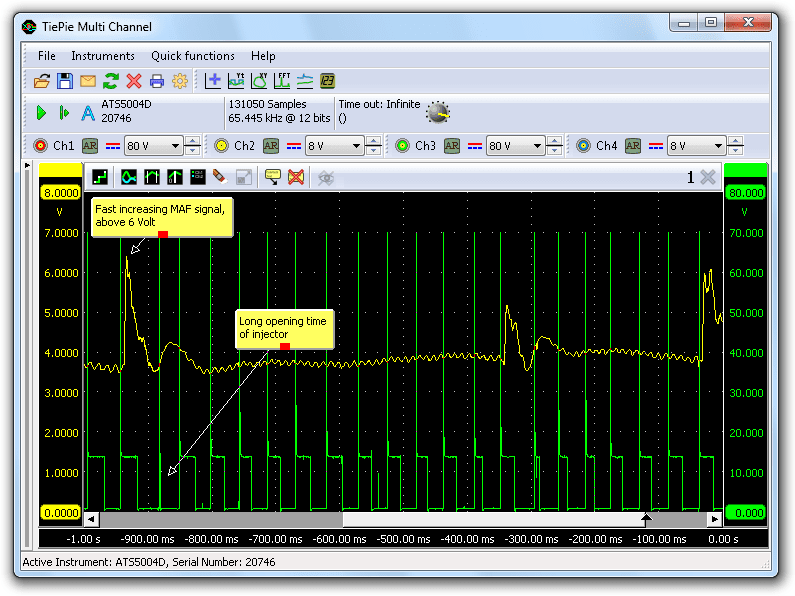
Both the MAF signal and the injection signal change when the engine holds back. The MAF signal shows a large increase to even more than 6 V, while it normally remains around 4.5 V. The injector signal shows a long opening time during the problem, leading to too much fuel in the cylinder. The high peaks in the MAF signal turned out to correspond with the explosions in the exhaust.
Measuring the turbo pressure
The MAF sensor measures the amount of air entering the engine, so the Engine Control Module (ECM) can adjust the amount of fuel to be added for optimum combustion. The large peaks in the MAF signal indicate a much higher air flow, which could be caused by the turbo. Therefore, the next things to measure were the turbo pressure, the turbo pressure valve control signal and the MAF sensor signal.
The motor management system on this engine has no turbo pressure sensor, therefore an external pressure sensor had to be added to the system. The APS260 Absolute Pressure Sensor enables to measure intake manifold vacuum and turbo pressure between 0 and 260 kPa (2.6 Bar). The APS260 is connected to Ch1 of the automotive oscilloscope.
The turbo pressure valve regulates the turbo pressure. The valve is controlled by the ECM using a pulse width modulated signal. The duty cycle of this signal determines how much the valve is opened or closed. The automotive measurement software for the diagnosis oscilloscope has a function to measure such a signal and directly display the duty cycle in a graph. The turbo pressure valve signal is connected to Ch3.
Ch2 measures the MAF signal. All three signals can be seen in Figure 3.
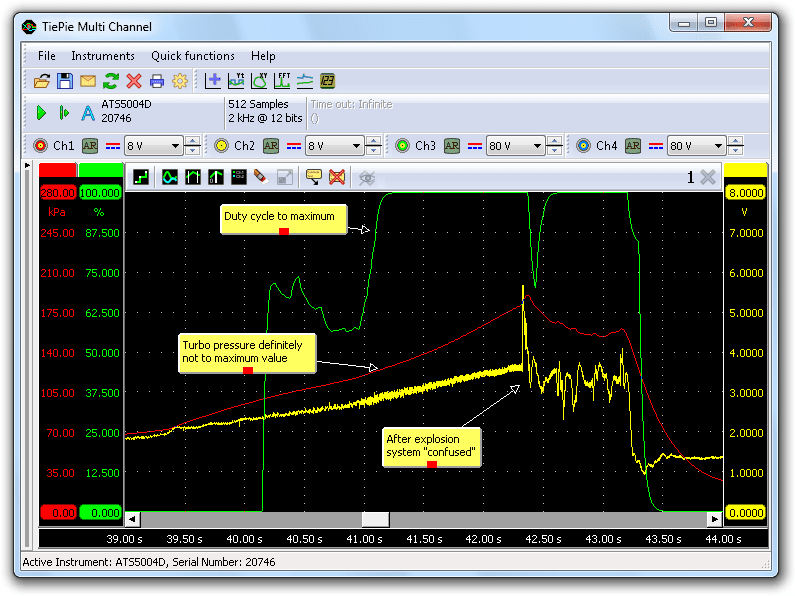
The turbo pressure valve signal increases very fast to 100%, meaning that the motor management system requires more turbo pressure. The turbo pressure itself increases only slowly and the signal from the MAF sensor does not increase very fast either, indicating no fast increase in air flow. Since this system has no turbo pressure sensor, the ECM has to get its information for controlling the turbo pressure from the MAF signal. With a too low MAF signal, the turbo pressure will have to be increased to get a larger air flow, which can be seen in the turbo pressure valve signal going to maximum.
Explosion
Clearly visible in Figure 3 is that the MAF signal at some point suddenly rises strongly, way beyond a normal maximum value. Shortly after that, the ECM tries to compensate for the large increase in airflow by partly closing the turbo pressure valve, the duty cycle drops to 70%. Instead of improving the situation, that only makes it worse. The MAF signal starts fluctuating and the turbo pressure drops. The conclusion is that the explosion in the exhaust causes the sudden large increase of airflow.
If the MAF sensor is contributing in the problem, it can be interesting to see what happens when this sensor is temporarily disconnected. The engine will normally go to an emergency state and use certain default values. It turned out however that the the engine still showed the same problems: holding back and explosions in the exhaust. That indicated that the wrong path had been followed.
Cause
Back to basics: measure fuel pressure, compression and ignition. What turned out: when idling, the fuel pressure was a proper 250 kPa (2.5 bar). But when the vacuum from the fuel pressure regulator was disconnected, the fuel pressure rose to only 270 kPa, while it should be around 300 kPa. Even when the return path was closed, the pressure remained 270 kPa, while this should result in a pressure increase to about 600 kPa. All together, this was enough information to point out the fuel pump as the cause of the problem.
Solution
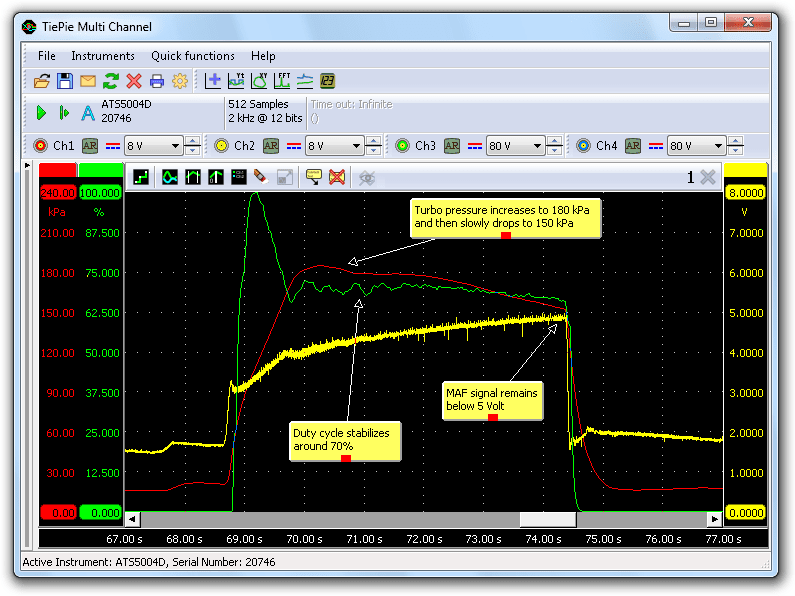
The problem was solved by replacing the fuel pump. Figure 4 shows the turbo pressure and the MAF signal after replacing the pump. Pressure build-up and MAF signal look good and the duty cycle stabilizes at 70%.
Conclusion
This car proves the importance or proper diagnostics: start with the basics and do not skip parts.
The explosions in the exhaust were probably caused by a too lean fuel mixture. Due to the increase in the MAF signal caused by the explosion, the injectors were opened a bit longer, which kept the engine running. But then the system stabilized in a too lean situation again and the process repeated. With the new pump, the engine power was measured again, now generating 108 kW, as shown in Figure 5.
R. Metzelaar