Sensor and actuator information
| Actuator type: | DC motor |
|---|---|
| Power supply: | - |
| Signal type: | Duty cycle varying, positive or negative |
| Signal level: | -12 V to 12 V |
| Sensor type: | Potentiometer |
|---|---|
| Power supply: | 5 V and GND from ECU |
| Signal type: | Amplitude varying |
| Signal level: | 0.5 V to 4.5 V |
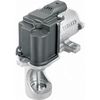
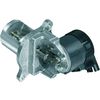
Workings of an EGR valve
The EGR valve (Exhaust Gas Recirculation valve) can let a certain amount of exhaust gases flow back into the inlet. This lowers the burning temperature and the emission of nitrogen oxide (NOx). The EGR valve is situated between the exhaust and inlet. The EGR valve that is measured is equipped with a DC motor to control the valve and an EGR valve position sensor to give feedback to the ECU about the position of the EGR valve. The EGR valve is spring loaded to keep it closed.
The DC motor is mechanically connected to the valve to keep it open in a certain position against the spring pressure. Both terminals of the DC motor are connected to the ECU which controls the DC motor both when opening and closing the EGR valve. If the motor is not activated, the valve should be closed.
The EGR valve position sensor is a potentiometer which is used by the ECU to determine the position of the EGR valve. The potentiometer contains a carbon track over which a slider slides that is mechanically connected to the EGR valve. One side of the carbon track is connected to the power supply and the other side to the ground. The sensor signal is produced from the slider that moves over the carbon track which changes the signal voltage. With this signal voltage the ECU can determine the position of the EGR valve.
Connecting the lab scope
Correct functioning of the EGR valve can be checked by measuring the following signal voltages, see figure 1:
| Channel | Probe | Voltage | Range |
|---|---|---|---|
| 1 |  |
Signal voltage at positive side of DC motor | 20 V |
 |
Signal voltage at negative side of DC motor | ||
| 2 |  |
Signal voltage at sensor | 8 V |
|
Ground at battery | ||
| 3 |  |
Positive side of sensor power supply | 8 V |
|
Negative side of sensor power supply |
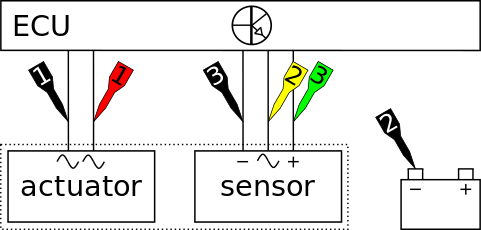
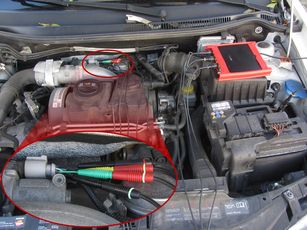
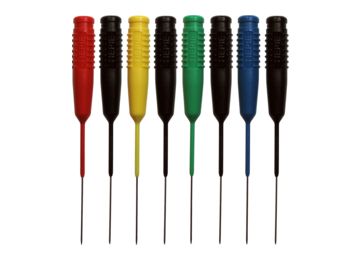
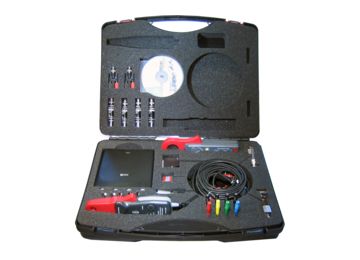
The lab scope is connected to the EGR valve DC motor and position sensor via a Measure lead TP-C1812B and Back Probe TP-BP85 and set to recorder mode.
In recorder mode a streaming measurement is performed, continuously displaying the signals live on screen. Most measured signals vary slowly, except for the DC motor control signal. The Automotive Test Scope ATS5004D is set to a streaming speed of 10 kS/s to correctly capture all signals.
Measuring
Figure 3 shows waveforms of an EGR valve DC motor and position sensor of a car with engine at operating temperature under following conditions: starting, 2000 RPM, 3000 RPM and idle. These signals can be downloaded and used to correctly set up the lab scope or as reference signal.
Download EGR valve DC motor and position sensor measurement
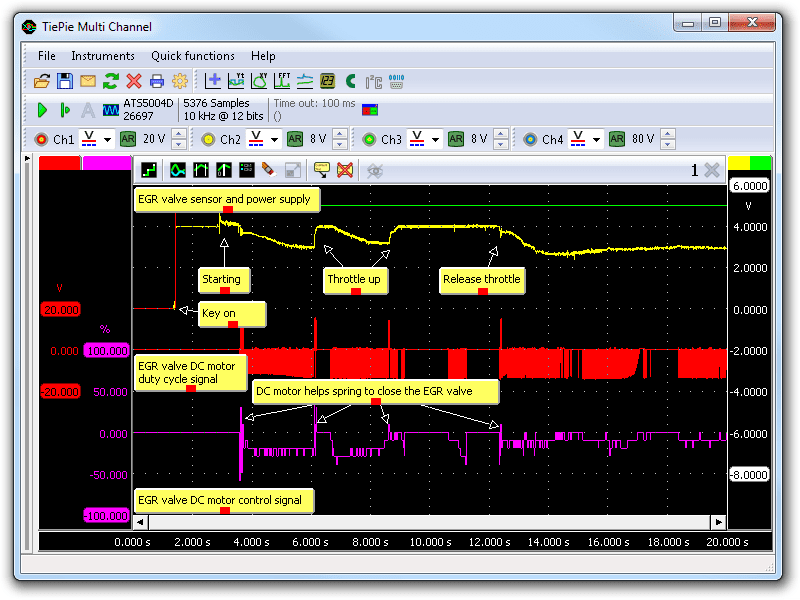
Channel 1 (red) shows the duty cycle signal of the EGR valve DC motor which is converted to the DC motor control signal (purple). Channel 2 (yellow) shows the position sensor signal and channel 3 (green) the position sensor power supply. At the beginning of the measurement the key is turned on and the engine is started. Because the engine is warm, the ECU applies a negative voltage to the DC motor which makes the EGR valve open, which is visible in the slight drop of the position sensor signal voltage. Subsequently the throttle is opened twice during the measurement to increase the engine speed to 2000 RPM and 3000 RPM, to which the ECU responds by closing the EGR valve which can be seen in the DC motor control signal. The ECU does this by applying a positive voltage to the DC motor to assist the spring with closing the EGR valve. When the throttle is released, the EGR valve is slightly opened again and the opening is further adjusted when the engine is back to idle speed again.
Diagnosis
Signal values may differ on different types of engine control units and EGR valves. Consult ATIS for information on specific engine control units and EGR valves.
The following EGR valve DC motor signal (channel 1) deviations can indicate a problem:
-
No signal:
Cause: back probes have no connection (perform a connection test), EGR valve DC motor defective, ECU amplifier defective -
Signal shows more noise than example signal:
Cause: wires of signal damaged, poor connection in connector terminals, EGR valve DC motor defective -
Signal voltage too high:
Cause: poor or no ground for the ECU, resistance in wiring to ECU -
Signal shows an offset:
Cause: scope is not set to DC coupling:
The following EGR valve position sensor signal (channel 2) deviations can indicate a problem:
-
No signal:
Cause: back probes have no connection (perform a connection test), no power supply, sensor defective -
Signal voltage too high:
Cause: poor or no ground on power supply, resistance in wiring to ECU, sensor defective -
Signal shows more noise than example signal:
Cause: signal wires damaged, poor connection in connector terminals, sensor defective -
Signal shows an offset in relation to the example signal:
Cause: scope is not set to DC coupling:,
poor or no ground, resistance in wiring to ECU.
RELATED PRODUCTS


RELATED ARTICLES
- Oxygen sensor zirconia
- With a lab scope a zirconia lambda sensor is measured on an idling engine at operating temperature. The signal from the sensor is shown and can be downloaded. To help determining whether a zirconia lambda sensor and its heating is functioning correctly, different possible deviations from the example signals are mentioned along with probable causes.
- Broadband Oxygen Sensor
- With a lab scope a broadband oxygen sensor signal voltage is measured. The sensor signal is shown and can be downloaded. To help determining whether the broadband oxygen sensor is functioning correctly, different deviations from the example signal are mentioned along with possible causes.
This document is subject to changes without notification. All rights reserved.
The information in this application note is carefully checked and is considered to be reliable, however TiePie engineering assumes no responsibility for any inaccuracies.
Safety warning:
- Before measuring, check that sources of dangerously high voltages are switched off or shielded from contact. Voltages considered to be dangerous are voltages over 30 V AC RMS, 42 V AC peak or 60 V DC.
- Keep a clean working environment when doing measurements.
- This measurement and procedures are a examples / measuring suggestions and are no prescribed protocols.
- TiePie engineering can not anticipate the safety actions that need to be taken to protect persons and appliances. Before starting a measurement, check which safety measures need to be applied.